FlowObservations
GSIM Global Streamflow Indices and Metadata
Do, Gudmundsson, Leonard and Westra (2018). Streamflow indices and catchment boundaries for 30,959 gauges.
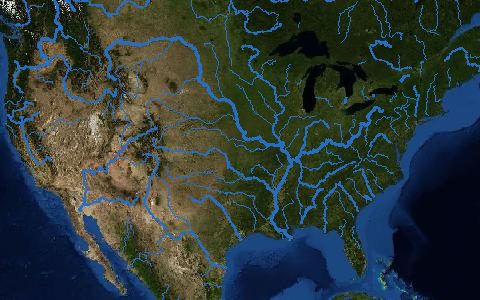
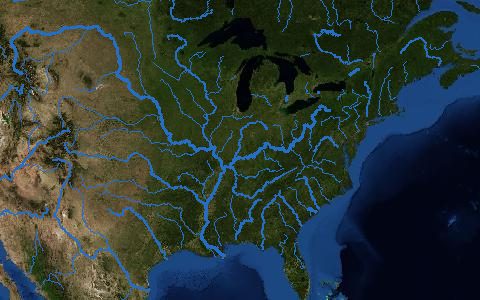
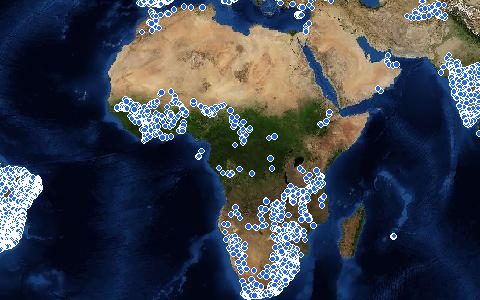
Station metadata and catchment boundaries (part 1) and derived streamflow indices (part 2) for 30,959 stations merged from 12 national and international archives. The gauge layer on this map is built from the GSIM station catalogue.
- Source
- PANGAEA Data Publisher
- Resolution
- Station data
- Data type
- Station data and catchment polygons
- Time span
- 1806–2016
- Temporal
- Monthly, seasonal and yearly indices
- Access type
- Direct download (external)
- Formats
- CSV, Shapefile
- Coverage
- Global (-180, -90, 180, 90)
- Licence
- CC BY 4.0
- DOI
- 10.1594/PANGAEA.887477
- Provider page
- doi.org/10.1594/PANGAEA.887477
Cite as. Do, H. X., Gudmundsson, L., Leonard, M., Westra, S. (2018). The Global Streamflow Indices and Metadata Archive (GSIM), Part 1. Earth System Science Data, 10, 765–785. https://doi.org/10.5194/essd-10-765-2018
Access
linkPart 1, metadata and catchments (PANGAEA)
linkPart 2, streamflow indices (PANGAEA)
curl "https://hydrological.org/api/v1/datasets/gsim/links?bbox=-75,-20,-50,5" \
  -H "Accept: application/json"
import requests
r = requests.get("https://hydrological.org/api/v1/datasets/gsim/links",
params={"bbox": "-75,-20,-50,5"})
for group in r.json()["groups"]:
for link in group["links"]:
print(link["url"])const res = await fetch("https://hydrological.org/api/v1/datasets/gsim/links?bbox=-75,-20,-50,5");
const { groups } = await res.json();
for (const g of groups) g.links.forEach(l => console.log(l.url));Also available as JSON: links · manifest · dataset record